Four terms answer four different questions
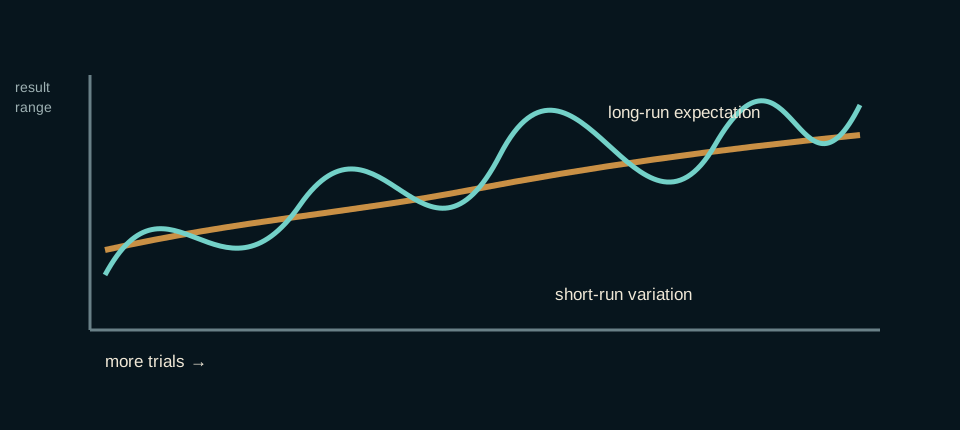
Probability describes how likely a defined outcome is under a stated model. Expected value combines possible outcomes with their probabilities to describe a long-run average per decision. House edge expresses an expected disadvantage as a proportion of the amount wagered. Variance describes how widely actual short-run results can move around expectation.
None of these terms predicts the next result. A low house edge does not mean a session is likely to be profitable, and high variance does not improve expectation. Precise language prevents a common mistake: using one reassuring number to answer a question it was never designed to answer.
Independent trials do not keep a memory
When outcomes are independent, the mechanism does not compensate for a previous run. Several results of one kind do not make the opposite result “due.” The gambler’s fallacy feels persuasive because people expect small samples to resemble the long-run distribution more neatly than randomness requires.
Independence is a model property, not a slogan that applies to every process. Rules, physical equipment or card removal can change conditional probabilities. The correct approach is to understand the game structure rather than transfer a belief from one game to another.
House edge is an average, not a session fee
If a game has a stated expected disadvantage, the actual cost in a short session can be lower, higher or even temporarily positive. The edge becomes informative over repeated exposure, but an individual trajectory remains uncertain. Multiplying a percentage by turnover can estimate expected loss under the model; it cannot guarantee the bill.
Turnover matters because money can be wagered repeatedly. A person who starts with a fixed amount may cycle portions of it many times. Comparing the edge only with the initial deposit understates exposure. Time, pace and average wager influence total action.
Variance explains emotional whiplash
Two games with similar expected disadvantage can feel very different when outcome sizes and frequencies differ. Long quiet stretches interrupted by a large result create a different experience from many small changes. Variance describes dispersion, but marketing language may substitute vague labels such as “hot,” “high energy” or “frequent wins.”
A win frequency can also be misleading when many wins return less than the amount wagered. Define what counts as a win and whether the measure describes profit, any payout or a feature event. A percentage without a denominator and definition is not enough.
A short record cannot validate a system
People naturally remember vivid sequences and successful decisions. A strategy tested over a few dozen outcomes can look convincing because random paths contain clusters. Changing stake size can reshape the timing and size of results, but it does not convert a negative expected value into a positive one unless the underlying payoff or information genuinely changes.
Simulation is useful for seeing ranges, drawdowns and variation, not for discovering a guaranteed sequence. A responsible simulation states rules, probabilities, payoff, sample size and assumptions. It also shows many runs rather than selecting the most dramatic path.
How to inspect a probability claim
If a claim promises a pattern, ask what mechanism creates dependence. If it compares games, check whether stake, speed and rules are equal. If it cites a return percentage, check jurisdiction, version and whether the figure is theoretical or observed.